 Justin Caniglia
 Daniel D. Snow
 Tiffany Messer3
- 1School of Natural Resources, Institute of Agriculture and Natural Resources, University of Nebraska-Lincoln, Lincoln, NE, United States
- 2Water Sciences Laboratory, Nebraska Water Center, University of Nebraska-Lincoln, Lincoln, NE, United States
- 3Department of Biosystems Engineering, College of Engineering, University of Kentucky, Lexington, KY, United States
- 4Department of Civil and Environmental Engineering, College of Engineering, University of Nebraska-Lincoln, Lincoln, NE, United States
Given the ubiquitous detection of per- and polyfluoroalkyl substances (PFAS) within numerous soil and water environmental compartments, there is a need for global understanding of current methodologies for extracting water, solids, polar organic chemical integrative samplers (POCIS), and plant tissue for these substances. This study provides details of several current extraction methods, demonstrates the use of POCIS in monitoring these compounds in a wastewater environment, and provides evidence of detectable levels of certain PFAS compounds within Midwestern municipalities and agroecosystems. Validated extraction procedures help characterize occurrence and release of 18 PFAS in a midwestern wastewater treatment plant (WWTP), surface water, runoff after land application of biosolids to agricultural test plots, infiltration into topsoil, and uptake by grain sorghum. Of the compounds measured, 14 PFAS were detected at least at one sampling site or type. The average total (Σ PFAS) dissolved phase time-weighted average (TWA) concentration in wastewater influent, effluent and in the upstream and downstream effluent mixing zone (EMZ) sites in the receiving stream, respectively, were 27.9, 132, 37.7, and 71.4 ng L−1. Long-chain PFAS dominated most of the aqueous compartments, and perfluoroalkyl acids (PFAAs) occurred in the WWTP and receiving surface waters. Total Σ14 PFAS measured in municipal biosolids applied to soils were 22.9 ng g−1 dw with long-chain PFAS comprising 77.5% of the cumulative PFAS mass. Perfluorooctanesulfonic acid (PFOS) was the most abundant compound detected in biosolids at the highest concentration (9.40 ng g−1 dw). Accumulation in WWTP biosolids was estimated to occur at a rate of 72.8 g day−1 dw based on the difference between influent and effluent time weighted average concentrations. PFAS were detected in both surface soil and runoff after land application of biosolids, but also in control plots consistent with background PFAS contamination. PFAS concentrations in surface runoff decreased over time from plots treated with biosolids. These results provide evidence of the introduction of PFAS to agroecosystems from wastewater effluent and land application of biosolids in the Midwest.
Introduction
Per- and polyfluoroalkyl substances (PFAS) are a diverse suite of environmentally persistent contaminants first developed in the late 1930's and manufactured for industrial and consumer goods (KEMI, 2015). There are more than 3,000 estimated variations of PFAS (Wang et al., 2017). PFAS are resistant to water, oil, grease, and heat making them useful in numerous industrial and consumer goods including, but not limited to, fabrics and food packaging, fire-fighting foam, cosmetic products, household products, paint, non-stick products, electronics, medical devices, etc. (KEMI, 2015). PFAS are fluorinated organic compounds with unique chemical traits such as oil-repellency (oleophobicity), hydrophilicity-hydrophobicity, lipophilicity, and reduction in surface tension (surfactant) (KEMI, 2015; Wang et al., 2017; Park et al., 2020). Thus, as surfactants PFAS are readily available to partition to surface interfaces.
PFAS have been measured in a variety of environmental and human matrices including sediment and biosolids (Chu and Letcher, 2017), crops (Semerád et al., 2020), groundwater (Bao et al., 2019), surface water (Nakayama et al., 2010), human serum (Domingo and Nadal, 2017), and aquatic wildlife (Ahrens and Bundschuh, 2014). Exposure to PFAS has been associated with human health risks including elevated cholesterol (Winquist and Steenland, 2014; Dong et al., 2019), altered immune system function (Steenland et al., 2013), thyroid hormone disruption (Webster et al., 2014), reduced fertility (Vélez et al., 2015; Lum et al., 2017), pregnancy-induced hypertension (Holtcamp, 2012; Darrow et al., 2013), as well as kidney and testicular cancer (Barry et al., 2013). The United States Environmental Protection Agency (EPA) currently has a recommended 0.004 and 0.002 ng L−1 lifetime health advisory concentration for perfluorooctanoic acid (PFOA) and PFOS in drinking water (USEPA, 2022). The mechanisms through which humans experience chronic exposure routes to PFAS are not well-known, identifying these routes of is critical to minimizing human health risks.
Municipal wastewater treatment plants are known to release PFAS into lotic environments (Sinclair and Kannan, 2006; Zhang et al., 2013; Gonzalez et al., 2021). During 2010 and 2011 Campo et al. (2014) detected PFAS in Spanish WWTP effluent ranging from 0.02 to 76.7 ng L−1 with a max Σ21 PFAS in 2010 of 567 ng L−1. An alternate route for PFAS transport within a WWTP is association with biosolids. Venkatesan and Halden (2013) determined the mean load of PFAS in US biosolids to be estimated to be on the order of 2,749 to 3,450 kg year−1. A recent study detected PFAS within the influent, effluent, and biosolids in a New Hampshire WWTP (Tavasoli et al., 2021). In addition, municipal WWTP biosolids are often land applied as a soil conditioner and fertilizer. Although there are numerous benefits of biosolids application to soils, this represents a pathway for transporting contaminants, such as PFAS, to adjacent groundwater, plants, tile drainage systems, and soils (Gottschall et al., 2017). Biosolids are applied to ~0.1% of agricultural land in the US, annually resulting in release of roughly 1.5 to 2.3 mg of PFAS per acre per year (Lu et al., 2012; Venkatesan and Halden, 2013; USDA, 2014). A recent study of PFAS in agricultural soils following the land application of municipal biosolids concluded a potential source of PFAS within the aquatic environment is through redistribution and leaching of biosolid amended soils from agricultural fields (Chu and Letcher, 2017).
Several published analytical techniques have been described for measuring PFAS in a variety of matrices, though environmental collection methods can be complicated to due to the ubiquitous occurrence of these compounds. Extraction protocols developed by regulatory agencies are limited to a few matrices, such as EPA Method 537.1 for drinking water (Shoemaker and Tettenhorst, 2020). Recent efforts have extended beyond these matrices providing means for measuring PFAS in serum (Harrington, 2017), resin within polar organic chemical integrative samplers (POCIS) (Gobelius et al., 2019), biosolids (Boiteux et al., 2016), and soil (Rankin et al., 2016), several of which employ isotope dilution and liquid chromatography-tandem mass spectrometry (LC-MS/MS). Current methods are typically time and labor-intensive, and the absence of simplified protocols for sampling and analysis in environmental matrices is a significant obstacle for researchers.
The objectives of this paper are to (1) report efficiencies of several pre-validated extraction methods to be used with liquid chromatography tandem mass spectrometry (LC-MS/MS) for analysis of PFAS in four environmental matrixes: non-potable water, POCIS, solids (soil and biosolids), and plants; (2) assess the fate and transport of PFAS from WWTPs to surface waters and to runoff from fields receiving municipal biosolids; and (3) estimate a mass balance of PFAS within a WWTP and agricultural soils receiving municipal biosolids.
Materials and methods
Chemicals and materials
The 18 linear PFAS measured in this study are listed in Table 1 and standards were purchased from Wellington Laboratories, USA. These 18 PFAS of interest include perfluoroalkyl ether carboxylic acids (PFECA), polyfluoroalkyl ether sulfonates (PFES), perflourinated sulfonic acid (PFSA), perfluorinated carboxylic acids (PFCA), and PFAS precursors. The three isotope-labeled internal standards (IS): d3-NMeFOSAA, 13C4 -PFOS, and 13C2-PFOA, and four isotope-labeled surrogates 13C2-PFHXA, 13C3-HFPO-DA, 13C2-PFDA, and d5-NEtFOSAA were also obtained from Wellington Laboratories, USA. Standards and surrogates were added in a concentrated methanol solution. All reagents, unless otherwise noted, were of the highest grade offered by manufacturers (≥97% purity) and care was taken to minimize background contamination during sample preparation. High purity methanol (≥99.99%, Honeywell CHROMASolv LC MS) was purchased from Midland Scientific Corporation, USA. Tetra-butylammonium hydrogen sulfate (TBAS), sodium carbonate (Na2CO3), and sodium hydroxide (NaOH) were purchased from Aldrich Chemical (Milwaukee, WI, USA). Methyl tert-butyl ether (MTBE), formic acid, and acetonitrile (ACN) were purchased from Fisher Scientific (Pittsburg, Pennsylvania, USA). Highest purity nitrogen and argon gas (≥99.99%) were used.
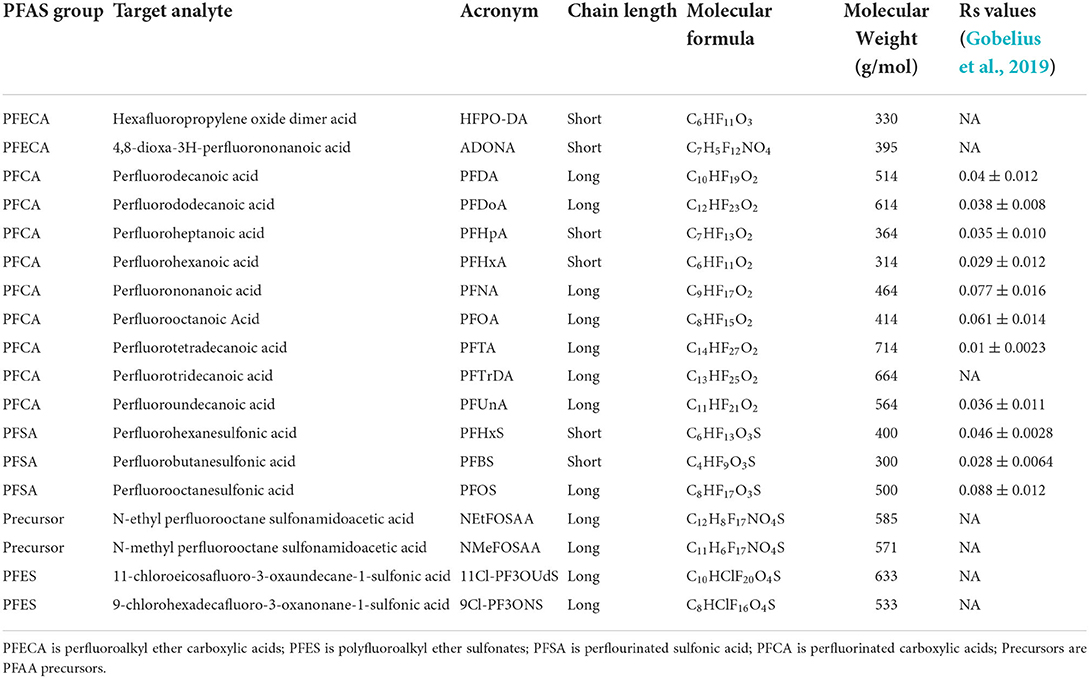
Table 1. PFAS groups, acronyms, chain lengths, molecular formulas, and molecular weights, measured in this study, together with published POCIS (HLB resin) uptake sampling rates (Rs) reported by Gobelius et al. (2019) which were calculated at flowing conditions at 20°C.
The stainless-steel holders, cages, and POCIS were purchased from Environmental Sampling Technologies (EST) Inc., Missouri, USA. Hydrophilic-lipophilic balance (HLB)-type POCIS (poly[divinylbenzene]-co-N-vinylpyrrolidone; 200 mg; 30 μm; Waters, USA) were used for WWTP and surface water monitoring. Surface runoff grab samples were collected and extracted with Sep-Pak PS2 cartridges (styrene-divinylbenzene (SDVB) copolymer; 500 mg; 80 μm particle size; Waters, USA). Polypropylene (PP) filters housed in PP (0.45 μm pore size; 25 mm), 60 mL Sep-Pak reservoir, reservoir adaptors, QuEChERS cleanup salts (6 g MgSO4; 1.5 g NaCH3COO), and 15 mL dispersive solid phase extraction (SPE) tubes (900 mg MgSO4; 300 mg primary secondary amine, PSA) were purchased from Waters Corporation (Milford, Massachusetts, USA). A polypropylene (PP) manifold cover housing stainless steel needles was purchased from Millipore Sigma (St. Louis, Missouri, USA) and used exclusively for this method. Empty 6 mL PP SPE cartridges with 20 μm polyethylene (PE) frits and 30 mL capacity PP funnels were obtained from Millipore Sigma (St. Louis, Missouri, USA). Three hundred micro liter PP conical vials and pre-slit polytetrafluoroethylene silicone septum screw caps were used to store final extracts (Waters; Milford, Massachusetts, USA).
Sample collection
The WWTP serviced an average of 80,000 m3 day−1 from a highly urbanized setting in Lincoln, Nebraska. After securing permission from the WWTP facility, POCIS were deployed in both the influent and effluent, as well as upstream of the effluent discharge and downstream in the effluent mixing zone (EMZ) in a stream with an average discharge of 215,617 m3 per day. The upstream site was 22 m above discharge and the EMZ site was 21 m below WWTP discharge. The EMZ is the area where the WWTP effluent is initially diluted within the receiving surface water. POCIS were deployed at the four sites for two sampling periods in 2020, sampling period one ranged from September 17th to October 1st and September 17th to October 15th, and sampling period two was from October 1st to October 15th. The WWTPs ultra-violet radiation (UV) disinfection period was from September 17th to October 1st and disinfection ceased after October 1st. POCIS deployment periods ranged from 14 to 28 days. Effluent POCIS deployed from September 17th to October 1st during UV disinfection was destroyed due to turbulent flow. Influent and surface water sites were collected during disinfection and after while effluent was only collected after disinfection ceased. POCIS were collected using nitrile gloves and immediately transported directly to the Water Sciences Laboratory in Lincoln, Nebraska. Exposed POCIS were stored at −20°C in virgin polypropylene bags until extraction.
Six agricultural test plots (University of Nebraska Rogers Memorial Farm) were established 2020. Each 25.2 m2 plot had a slope of 4–6%. Grain sorghum was planted in each plot May 2020. Biosolids produced by the WWTP plant were collected for the land application study and were applied to plots in early August 2020 due to COVID-19 restrictions. Two biosolid plots received 177 kg of municipal biosolids and two reference plots received no amendments. Two hundred and fifty milliliter grab samples of runoff were collected after precipitation events between August-October 2020 in new PP bottles. Samples were stored frozen at −20°C until extraction. Due to COVID-19 pandemic restrictions on field and laboratory activities, runoff sampling was limited to 3 precipitation-induced runoff events and sample storage time ranged from 10 to 11 months. Four hundred and fifty-four gram of soil and a fully grown grain sorghum plant were sampled from each plot. Plant tissues were collected from each plot and the top 10 cm of soil was sampled at the conclusion of the growing season in 2020. Samples were collected using stainless steel apparatus and nitrile gloves. All biosolid, plant, and soil samples were frozen in polyethylene zipper bags and stored at −20°C.
Estimation of time-weighted average (TWA) concentrations and mass flow
Uptake rates (Rs) used to estimate TWA concentrations for 11 of the 18 analytes of interest quantified in POCIS extracts were published by Gobelius et al. (2019). The TWA concentration of each analyte that was provided a sampling uptake rate (Rs) was calculated as follows:
Naderi Beni et al. (2020). Equations used to estimate mass flow are described by Pan et al. (2016) and are supplied in Supplementary material.
Extraction methodologies
Processing procedures for POCIS samples follow Gobelius et al. (2019) and included steps to minimize potential for cross-contamination. Briefly, POCIS devices were thawed before extraction. An empty 6 mL PP SPE cartridge with 20 μm PE frits were washed with 5 mL of methanol and 10 mL of purified reagent water. A 20 μm PE frit was placed tightly at the cartridge bottom and a 30 mL PP funnel was placed on top. The PES membranes of each POCIS were carefully separated and the HLB sorbent carefully emptied into the funnel. The funnel was rinsed with 30 mL of purified reagent water to ensure all resin particles were transferred. A second PE frit was then placed on top of the resin. The resin was then spiked with 4 ng of surrogate spike. Quality control samples received 1 ng of analyte spike to measure recovery (see Supplementary material for details). Residual water in the cartridge was removed by pulling air through for 2–30 min (<5 in Hg). A PP manifold cover was attached to elution manifold and 15 mL PP tubes were eluted with 20 mL of methanol. Eluent was slowly evaporated to dryness by heating (60°C) under a stream of nitrogen and then spiked with 2 ng of internal standard mix (see Supplementary material for details).
Water extraction methods generally followed procedures described by Shoemaker and Tettenhorst (2020). Samples were thawed and mixed by hand for 5 min. Turbid samples were filtered with a PP filter (0.45 μm pore size, 25 mm) and PP syringe. The sample was weighed and spiked with 4 ng of surrogate spike. Quality control samples, prepared by weighing purified reagent water, received 1 ng of analyte spike. Each cartridge was conditioned by passing 25 mL of high purity methanol and then 30 mL of purified reagent water through the cartridge without allowing the cartridge to go dry. A 60 mL Sep-Pak reservoir was attached to the cartridge and 60 mL of sample was poured into the reservoir. The sample was pumped by aspiration through cartridge at ~3 mL/min until all sample was extracted. The sample container was rinsed with two aliquots of 7.5 mL of purified reagent water and drawn through the cartridge. The cartridge was dried by pulling room air for 5 min (10–15 in. Hg), and the empty container weighed to determine total sample size.
Solid samples (biosolids and soil) were solvent extracted following procedures described by Rankin et al. (2016). Soil and biosolids were air dried and crushed into a fine homogonous mix using a clean mortar and pestle. A 5-gram (0.3 g for biosolids) sample was weighed into a 15 mL PP tube and spiked with 4 ng of surrogate spike. QC samples received 2 ng of analyte spike. Four hundred microliter of 2 M sodium hydroxide (NaOH) solution and 8.5 mL of 90:10 acetonitrile/water was added to each sample. Solutions were vortexed to mix, sonicated in an ice bath for 1 h, and then shaken on a rotary shaker for 15 h followed by centrifuging at 3,000 rpm for 15 min. Supernatant was decanted and this process was repeated by mixing solids with an additional 400 μL NaOH solution and 8.5 mL of 90:10 acetonitrile:water. Extracts were evaporated to near dryness (100–300 μL) under a stream of dry nitrogen gas. Final cleanup using TBAS ion-pairing was accomplished by mixing the extract with 4 mL TBAS ion solution (0.25 M Na2CO3, 0.5 M TBAS). Extract solution was vortexed with 5 mL MTBE and this final solution was separated at −20°C overnight. The supernatants were decanted. Aqueous extracts were finally filtered with a PP filter (0.45 μm pore size, 25 mm). Final solution cleanup step was repeated. The supernatants were combined and blown to dryness by heating under a stream of nitrogen gas. Once dry, each tube was spiked with 2 ng of IS (see Supplementary material for details).
Lastly, the following describes plant tissue extraction. All plant tissue samples were lyophilized, crushed, and homogenized before processing using procedures described by Organtini et al. (2021). A 0.5 g sample was weighed into a 50 mL PP centrifuge tube and spiked with 4 ng of surrogates. Fortified samples received 4 ng analytes to measure recovery (see Supplementary material for details). Tissue was mixed with 5 mL purified reagent water, 10 mL acetonitrile, and 150 μL formic acid by vortex and shaking for 1 min. QuEChERS salts were added, vortexed, and shaken for an additional 5 min. Mixtures were centrifuged at 3,300 g for 15 min, and supernatant decanted into 15 mL dispersive SPE tubes. Mixtures were vortexed, shaken for 5 min and centrifuged again at 3,300 rpm for 15 min. Supernatants were decanted into 15 mL PP tubes and evaporated to dryness by heating under a stream of nitrogen. Each tube was spiked with 4 ng of IS prior to dissolving in mobile phase (see Supplementary material for details).
Final extract volume
Dried extracts from all methods were dissolved in 300 μL 96:4% methanol:water and then transferred into a 300 μL conical PP autosampler vial using a PE transfer pipette. Each extract was analyzed for the 18 PFAS analytes using liquid chromatography tandem mass spectrometry (Table 1).
Instrumental methods
Chromatographic separation was performed using an Acquity H-Class Plus ultrahigh pressure liquid chromatography (UPLC) system with a 1.7 μm Premier BEH C18 column and equipped with a 2.1 × 50 mm isolator column interfaced to a Xevo TQ-S Micro triple quadrupole mass spectrometer system equipped with an Unispray™ source operating in a negative ion detection mode (Waters Corporation, Milford, MA). Gradient separation was accomplished at 35°C with a mobile phase flow rate of 0.30 mL/min. Mobile phase solvents: (I) 2 mM ammonium acetate in water; (II) 2 mM ammonium acetate in methanol. Initial conditions of 95%I and 5%II, hold until 0.5 min, then change to 75%I and 25%II, hold until 3 min, at 3 min through 6 min 50%I and 50%II, 6–6.5 min switch to 15%I and 85% II, 6.5–9 min 5%I ad 95%II, and 9–12 min back to initial conditions of 95%I and 5%II. Total analysis time is 12 min. Mass spectrometer settings were: collision gas: argon at 4.0 × 10⁻³ Torr; desolvation gas: N2 at 900 L/h; desolvation temperature: 400°C; cone gas: N2 at 10 L/h; source temperature: 150 °C; and capillary voltage: 0.5 kV. Collision energies, cone voltages, ion transitions, and retention times are listed in Supplementary Table 1. Injection volume was 5 μL. Peak integration and calculations of concentrations against the standard curve were performed using Waters Masslynx software v4.2.
A total of 7 standards spanning 0- to 20-ng/mL were used for the instrumental calibration curve. Using the standard deviation of the lowest calibration standard instrument detection limits ranged from 0.03 to 0.5 picograms (pg) on-column (Table 2). Method detection limits (MDLs) of water, solids and plant tissue samples were calculated using replicate analysis of a low-level fortified matrix (USEPA, 1986).
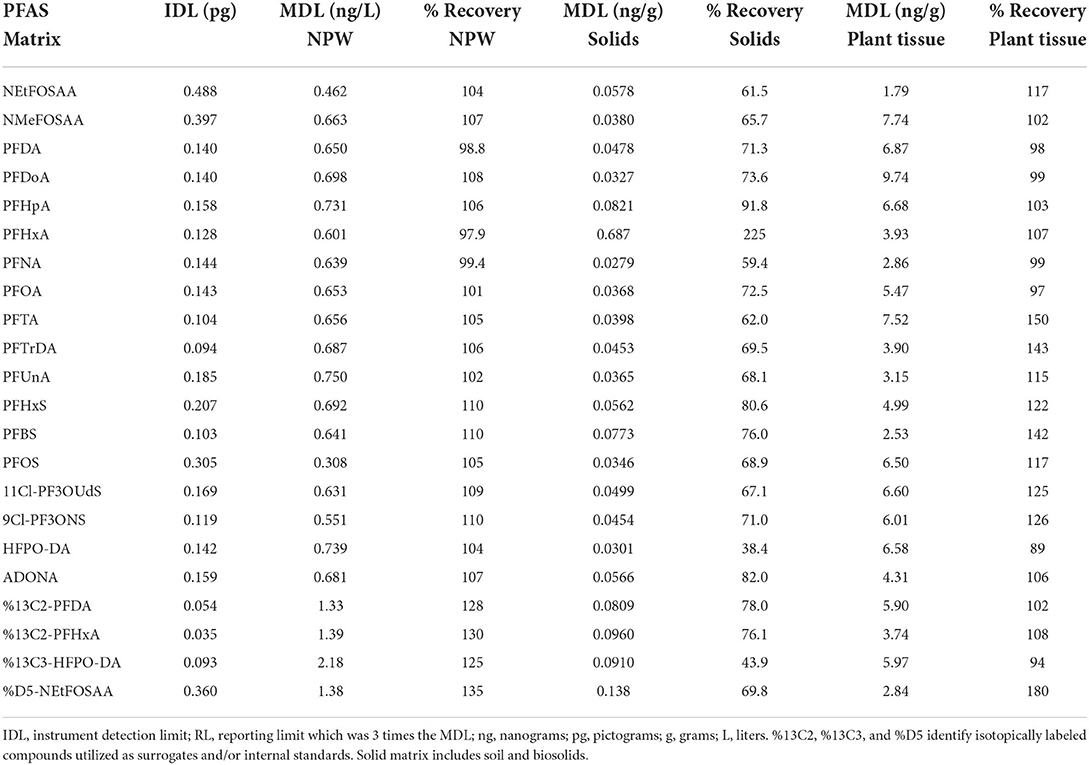
Table 2. Method detection limits (MDL) determined for the following environmental matrixes: crop, solids (soil and biosolids), and non-potable water (NPW).
Statistics
Statistical analyses included t-statistics and one-way ANOVA comparisons followed by Tukey's HSD. Significance level was set at α equal to 0.05. Data was normalized by natural log transformation on a need-by-need basis to improve residual plots. All recorded and detectable data values were utilized for statistical analysis (Helsel, 1990). Values below detection limits were allocated as “not detected, ND.” Sample sizes (n) varied throughout environmental matrices ranging from 1 to 4 for each sampling collection. All statistical computations were performed using statistical software (MiniTab Statistical Software, State College, PA; R-Studio, Bos, MA).
Results
Extraction efficiencies and method validation
Previously reported extraction methods for PFAS in water (Shoemaker and Tettenhorst, 2020), POCIS (Gobelius et al., 2019), solids (Rankin et al., 2016), and plant tissue (Organtini et al., 2021) use offline SPE procedures, liquid extraction with organic solvents utilizing sonication and shaking, QuEChERs and dispersive SPE employing liquid extraction, and extraction with organic solvents. Offline SPE procedures use surrogates to monitor recovery of analytes throughout sample prep and concentration steps. The use of deuterated internal standards helps correct for ion suppression and enhancement effects influenced by co-extracted contaminants as well as improves accuracy of analyte quantitation as final extracts may contain a suite of co-extracted contaminants which will affect ionization efficiency and may possibly influence recoveries (Snow et al., 2013). Field sample surrogate recoveries ranged widely between the four matrices evaluated indicative of complex matrices and the co-extraction of non-target contaminants. The average and standard deviation of surrogate recoveries for non-potable water, solids, POCIS, and crop samples were 93.6 ± 63, 63.1 ± 28, 101 ± 75, and 200 ± 121 per cent, respectively. Each sample matrix was validated. Offline SPE, IPE, QuEChERS salts, and dSPE were utilized for extraction and cleanup, and sensitivity of each compared for environmental matrices. Calculated MDL values and percent recoveries of 18 analytes of interest are reported in Table 2. MDLs values in this study for non-potable water, solids, and crop ranged from 0.308 to 0.750 ng L−1, 0.0279–0.687 ng g−1, and 1.79–9.74 ng g−1, respectively (Table 2). Average recoveries for 18 PFAS analytes for non-potable water, solids, and crop were 105 ± 4, 78.0 ± 38, and 114 ± 18 per cent, respectively (Table 2).
PFAS in the wastewater treatment plant
Of the 18 PFAS measured, 14 were detected at least once. 11Cl-PF3OUdS, 9Cl-PF3ONS, ADONA, and HFPO-DA were not detected within any POCIS extracts or municipal biosolids (Supplementary Table 3, Table 3). The majority of detected PFAS followed an increasing concentration trend from the influent wastewater to the effluent wastewater. Of the 14 measured PFAS, in ng/POCIS 12 out of the 14 (85.7%) were at measured at higher levels in in the effluent POCIS in comparison to the influent wastewater. Only two PFAS (PFOS, PFHxS) showed no observable significant differences between the influent and effluent concentrations (p-value > 0.05).
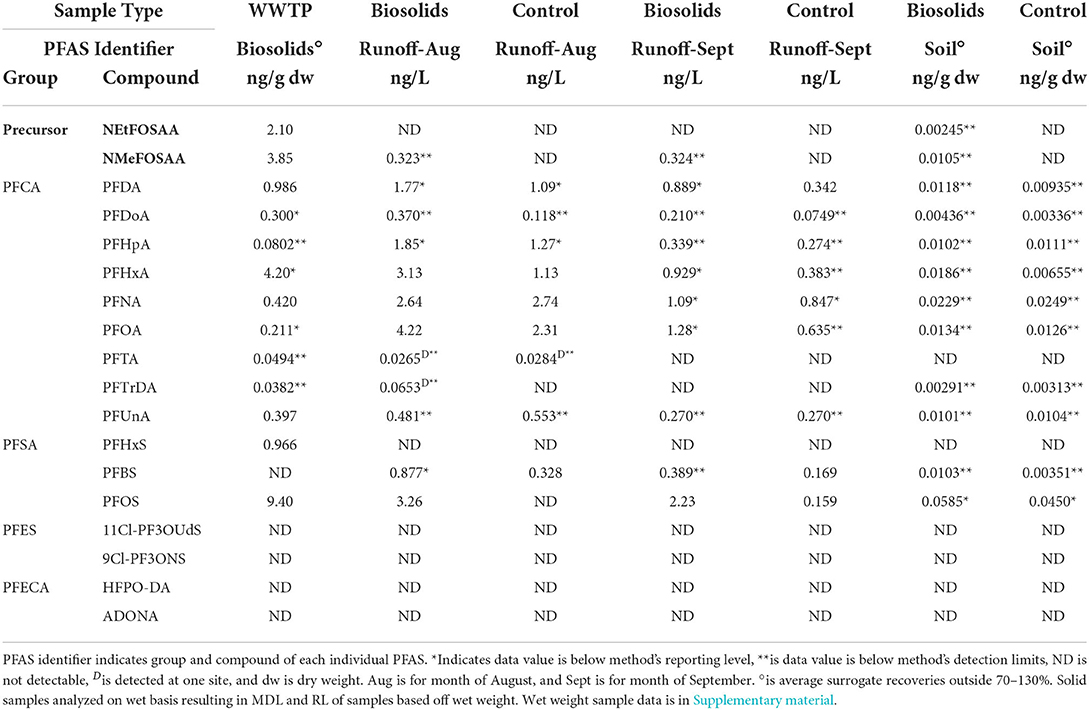
Table 3. PFAS detection summary for WWTP biosolids, runoff, soil, and crop. Sample type indicates WWTP biosolids, biosolids plot, or control plot.
Using uptake rates provided by Gobelius et al. (2019), we calculated TWA concentrations for 11 of the 18 PFAS of interest. The average TWA Σ11 PFAS found in WWTP influent and effluent sites, respectively, were 27.9 and 132 ng L−1 across both sampling periods (Table 4). Within the WWTP there were no differences in the average Σ11 PFAS between sampling periods. These results suggest that TWA concentrations varied widely within the WWTP. In the influent average TWA concentrations ranged from a low of 0.0403 ng L−1 for PFDoA to a high of 12.5 ng L−1 for PFOS (Table 4). Effluent TWA concentrations ranged from 0.621 ng L−1 for PFDoA to 39.5 ng L−1 for PFHpA (Table 4).
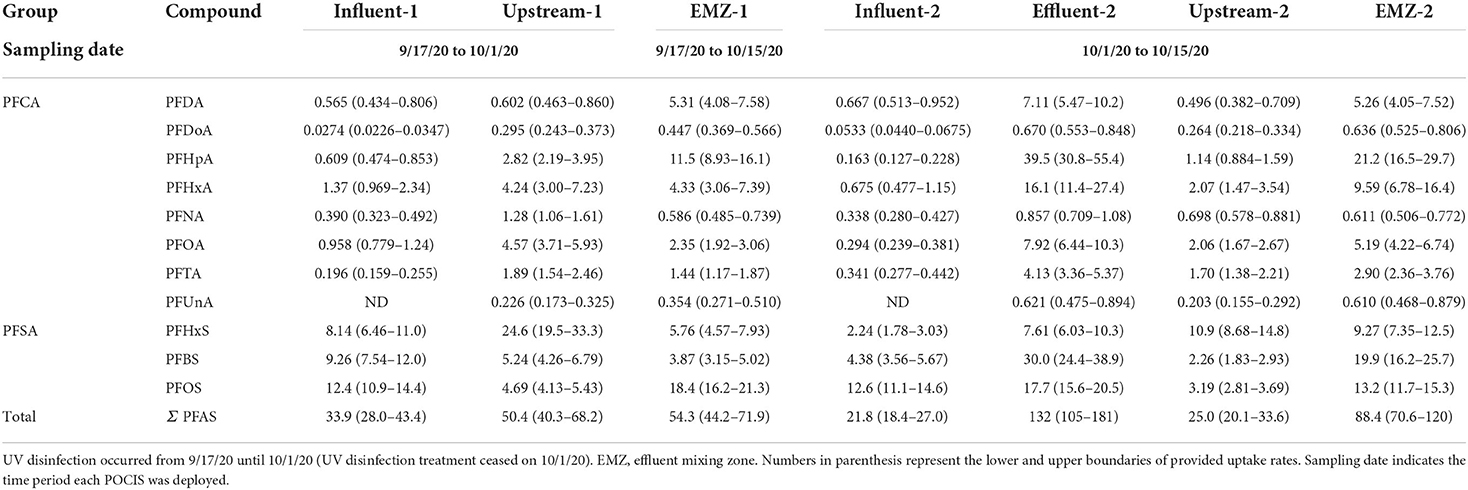
Table 4. Average time-weighted average (TWA) concentrations (ng L−1) of PFAS measured in WWTP and adjacent surface waters receiving effluent. POCIS sampling periods ranged 14–28 days.
The mass of dissolved PFAS entering and leaving the WWTP was estimated using calculated TWA obtained from the POCIS measurements. In the influent flow the average mass loading of the Σ11 PFAS was 2.60 g day−1, increasing to 10.5 g day−1 in the effluent. Represented in Figure 1, the influent mass loading for the Σ11 PFAS slightly decreased from sampling period 1 (3.39 g day−1) to sampling period 2 (1.81 g day−1), likely influenced by a minor decrease in influent flow (Supplementary Figure 1) All 14 PFAS detected within the WWTP were detected at the two surface water sites, with a trend of increasing concentrations from upstream to the EMZ. Twelve out of 14 PFAS were detected at higher concentrations in ng/POCIS in the EMZ compared to upstream. PFNA has no significant differences between sites (p-value > 0.05), while PFHxS was at higher concentrations upstream than within the EMZ.
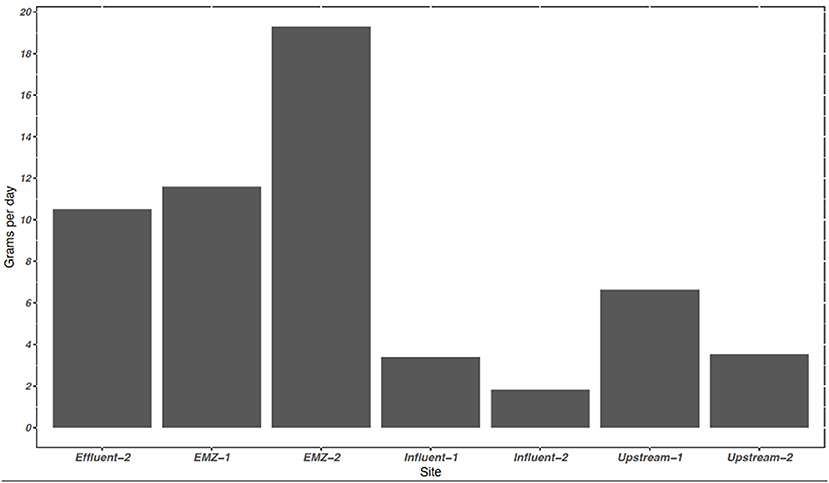
Figure 1. The average sum of the mass loading of 11 PFAS provided uptake rates at sampling sites in the WWTP and adjacent surface water system in grams per day (g day−1). The average discharge in influent, effluent, and surface water system in m3 day−1 were 91,757, 80,300, 215,617, respectively. Mass loading rate is based off of discharge and concentration. −1 represents sampling period 1 and −2 represent sampling period 2. EMZ, = effluent mixing zone.
Average TWA Σ11 PFAS found upstream and in the EMZ were 37.7 and 71.4 ng L−1 through both sampling periods (Table 4). At upstream site, TWA during sampling period 1 was >2 and in the EMZ sampling period 2 was >1. The average TWA concentrations between the two surface water sites was similar. Upstream ranged from 0.21 ng L−1 for PFUnA to 17.8 ng L−1 for PFHxS and EMZ ranged from 0.482 ng L−1 for PFUnA to 16.3 ng L−1 for PFHpA. The median TWA for the EMZ (5.29 ng L−1) was higher compared to the median at the upstream (1.98 ng L−1) site.
Estimated mass loading of detected compounds (Σ11 PFAS) upstream was 5.06 g day−1, while the downstream EMZ was roughly 3× higher at 15.5 g day−1. Upstream and EMZ mass loading showed slight temporal differences during our four-week sampling campaign. Upstream, mass loading decreased from sampling period 1 (6.63 g day−1) to sampling period 2 (3.52 g day−1), as shown in Figure 1. In contrast, the EMZ mass loading rate increased from sampling period 1 (11.6 g day−1) to sampling period 2 (19.3 g day−1). Short and long chain PFAS occurrence was variable between the four aqueous sites, as shown in Table 5. In the influent, effluent, upstream, and EMZ short chain PFAS compromised 27.8, 53.6, 60.7, and 37.8 percent, respectively, while long chain PFAS and 2 precursors compromised 72.1, 46.4, 39.3, and 62.2 percent, respectively.
Table 5. Percentage of the mass of the sum of PFAS between short and long chain in the three detected subgroups in the WWTP and surface water system.
Occurrence of PFAS in biosolids-treated agricultural plots
Land applied municipal biosolids had detectable concentrations of 13 PFAS, and Σ13 PFAS in biosolids was 22.9 ng g−1 dw. Detectable biosolid concentrations ranged from a low of 0.0382 ng g−1 dw for PFTrDA to a high of 9.40 ng g−1 dw for PFOS (Table 3). Class type and chain length of PFAS sequestered within biosolids may be important in handling and use of municipal biosolids (Higgins and Luthy, 2006; Venkatesan and Halden, 2013; Tavasoli et al., 2021). In this study, PFSAs compromised 45.2% of the Σ PFAS in biosolids, with 41% of the Σ PFAS detected being contributed by PFOS. Long chain PFAS contributed to 77.5% of the Σ PFAS in municipal biosolids. Mass loading of PFAS into biosolids at the WWTP was estimated (equation in Supplementary material) and results are shown in Figure 2. The mass load of the Σ13 PFAS in dewatered biosolids was 72.8 g day−1 dw, based on 12,701 kg of biosolids produced daily. The individual PFAS with the highest mass loading rate was PFOS at 29.9 g day−1 dw, followed by PFHxA at 13.3 g day−1 dw (Figure 2). Of the 18 PFAS measured, 12 PFAS were detected between the surface soil and runoff samples (Table 3). No PFAS were detected in the grain sorghum plant tissue grown on the plots or surrounding field (controls).
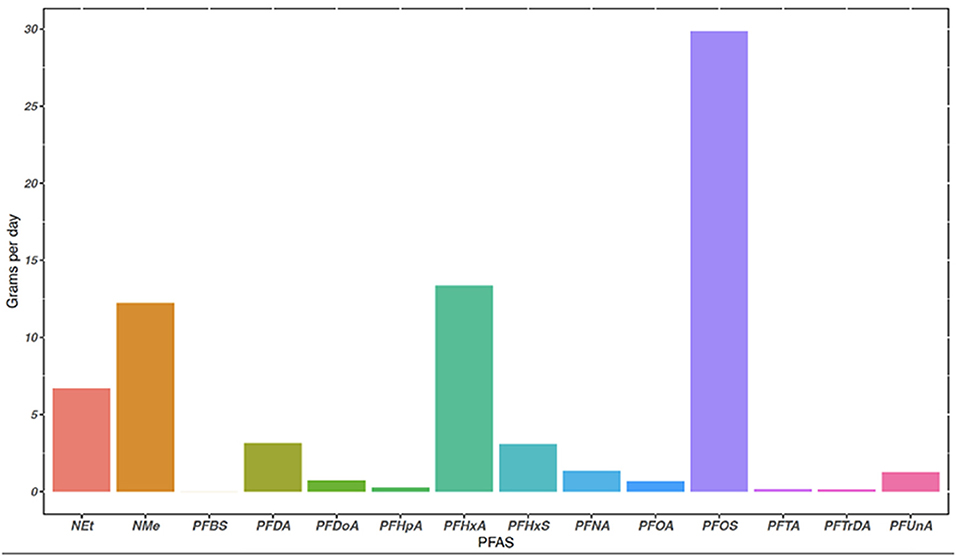
Figure 2. The mass loading of 14 PFAS sequestered in municipal biosolids at the Midwestern WWTP in grams per day (g day−1). Mass loading rate is based off average biosolids produced daily by the WWTP (kg/day) and detected concentrations (g/kg), equation to calculate mass loading (g day−1) is in Supplementary material.
In surface runoff samples from test plots treated with biosolids, the average Σ12 PFAS in August was 19.0 ng L−1 and in September it was 7.95 ng L−1. In the soil on biosolid treated plots, the Σ12 PFAS in the top 10 cm in October was 0.176 ng g−1 dw−1. The total measured Σ12 PFAS concentrations significantly decreased between runoff events sampled in August and September (p-value < 0.05). During the August sampling event PFOA was the highest detected PFAS at 4.22 ng L−1. While in September, PFOS was found at the highest concentration at 2.23 ng L−1. An estimated total of 4.06 mg of PFAS was land applied in 176 kg of municipal biosolids resulting in 0.126 mg of Σ12 PFAS in surface soil and an average loss of ~0.0005 mg of Σ12 PFAS in runoff. In the surface soil, individual PFAS mass ranged from 0.00100 mg for PFDoA to 0.0358 mg for PFHxA. Residual or background contamination by PFAS was indicated in control plots with detectable concentrations of PFAS. Runoff water in August on control plot had an average Σ12 PFAS of 9.57 ng L−1 and in September the concentration decreased to 3.15 ng L−1. In the soil control plots the average Σ12 PFAS was 0.130 ng g−1 dw.
Discussion
Occurrence of PFAS in the wastewater treatment plant
Based on limited sampling in the present study, 14 of the 18 measured PFAS occurred in raw and treated wastewater samples. Σ14 PFAS concentrations significantly increased in concentration from the influent to effluent. As with many trace organics, removal efficiency of PFAS in WWTP is low and many individual compounds can increase within the WWTP, consistent with other findings (Pan et al., 2016; Gallen et al., 2018; Tavasoli et al., 2021). Past studies have reported that PFAAs may increase in WWTPs after secondary treatment stages possibly due to the biodegradation of PFAS precursors, similar to findings stated here (Sinclair and Kannan, 2006; Lenka et al., 2021; Tavasoli et al., 2021). For example, the 8:2 fluorotelomer has degradational byproducts that can be a suite of PFBA, PFPeA, PFHxA, PFHpA, or PFOA (Mueller and Yingling, 2018). Our study found Σ11 PFAS in the effluent was more than four times the average TWA concentration detected in the influent implying that the treatment plant was a source of PFAS in effluent.
Concentrations and occurrence of PFAS in this study are similar to those reported in other studies. For example, Tavasoli et al. (2021) reported a max Σ of PFAS at 198 ng L−1 in a study of a New Hampshire WWTP. In six Californian WWTPs sampled by Houtz et al. (2016), they report an average concentration ranging from 3.5 ng L−1 for PFDA to 26 for PFHxA ng L−1. Our study reported a slightly wider range of average concentrations (0.621 ng L−1 for PFDoA; 39.5 ng L−1 for PFHpA). In California following an annual FAA required testing of airport firefighting foams, Houtz et al. (2018) detected PFBS at higher concentrations in effluent (~2–10 μg L−1) than detected in this study (30 ng L−1).
Estimated daily mass flow rates of 11 PFAS within the WWTP suggest that average flow of the Σ11 PFAS increased ~7.90 g day−1 from influent to effluent. The daily maximum loading rate for the Σ11 PFAS in the influent was 3.68 g day−1 and in the effluent was found to be 11.1 g day−1. Differences in community and industrial uses of PFAS laden products may affect predominant PFAS chain length and classes which occur in influent. Although industry is slowly phasing out long chain PFAS and replacing with short chain PFAS (KEMI, 2015), our results suggest that long chain PFAS still predominate. Tavasoli et al. (2021) found effluent to contain more shorter chain PFAS, similar to results indicated in this study.
PFAS in an effluent-dominated stream
Comparable levels of 14 PFAS detected within the WWTP were also detected upstream and in the EMZ of the adjacent surface water system. This finding suggests similar sources of PFAS may be introduced to surface waters and wastewater. The occurrence of low levels of PFAS upstream of the discharge may be a result of previous deposition from storm run-off. For example, Codling et al. (2020) identified stormwater runoff as a contributor of PFAS to respective surface water systems that receive this runoff. The Σ14 PFAS occurred at higher levels within the EMZ compared to upstream. This finding suggests that effluent discharge may be a significant source of PFAS to our surface water systems. Ahrens et al. (2009) indicated that levels of PFAS in adjacent surface waters may increase after receiving inputs from municipal effluent discharge and are also influenced by industrial discharge and surface runoff.
Variation in human usage of PFAS products may influence seasonal variations in the detection of individual PFAS. For example, in this study the Σ PFAS at our EMZ in time period 2 was 34.1 ng L−1 higher than EMZ time period 1. Our limited sampling time frame allowed for a short glance into temporal variations of PFAS reaching our surface waters.
The PFAS measured in the surface waters in this study have been found in other studies of surface water. PFOS, PFHpA, PFHxA, PFDA, and PFOA were found in the Yangtze and Pearl River in China (So et al., 2007). PFBS, PFOS, and PFOA in the Mississippi River (Nakayama et al., 2010) and Cape Fear River Basin in North Carolina (Heinze et al., 2008). PFOS and PFOA were found at highs of 245- and 125-ng L−1 in Mississippi River Basin, higher than concentrations (PFOS: 3.94–15.8 ng L−1; PFOA: 3.31–3.77 ng L−1) presented here (Nakayama et al., 2010). PFOA, PFHxA, and PFHpA in Rhine watershed in Switzerland (Gobelius et al., 2018), and PFOS in Vaal River in South Africa (Groffen et al., 2018). So et al. (2007) found low PFHpA and PFOS concentrations (0.074–9.2 ng L−1, <0.01–14 ng L−1) in the Yangtze and Pearl River in China which were similar to those in the present study. PFAS classes vary widely in their production and environmental release.
Gobelius et al. (2018) found PFCAs and PFSAs to be dominate PFAS in Swedish surface waters, similar to our findings shown in Table 5. At the upstream site, 71.2% of the detected compounds were in the group PFSAs and this decreased to 61% within the EMZ. Indicating that PFSAs dominated compounds detected in Nebraskan surface water in this study. Contrastingly, Ahrens et al. (2009) determined that PFCAs were the dominating group detected in their study. Most surface water studies to date are in a highly urbanized area impacted storm runoff, WWTP effluent, and partially industrialized areas (Zushi and Masunaga, 2009, 2011).
Supplementary Figure 4 presents the ambient temperature and quantity of precipitation for sampling locations. Surface water levels can be influenced by ambient air temperature and runoff from local precipitation events, which might have affected PFAS concentrations. Especially during EMZ-2 as it contained highest quantity of precipitation and greatest number of precipitation events.
Municipal biosolids
Municipal biosolids are known to contain a variety of PFAS, often at temporally varying concentrations (Venkatesan and Halden, 2013). Sampling in this study took place in August while sampling of influent and effluent wastewater took place over a month later. PFBS was not detected in biosolids but was found in influent and effluent. Comparatively, NEtFOSAA, PFTrDA, and PFUnA were detected in biosolids and effluent, but not within the influent flow. These results are possibly indicative of temporal variation in inflow PFAS concentrations into the WWTP, precursor biodegradation (Sinclair and Kannan, 2006), differences in adsorption potentials between chain lengths and PFAS groups (Higgins and Luthy, 2006; Pan et al., 2016; Tavasoli et al., 2021), and desorption rates.
The estimated accumulation rate of PFAS within biosolids occurred at a mean rate of 72.8 grams day−1. PFOS was the most abundant PFAS detected in our biosolids. This finding was similar to findings in a mass survey which incorporated United States biosolids from 94 WWTPs (Venkatesan and Halden, 2013). Their study reported that the average PFOS concentration in the United States was 403 ng g−1 dw, nearly 14 times greater than the concentration reported in this study (Venkatesan and Halden, 2013). It is likely that PFOS was a dominant PFAS due to the understanding that long chain PFAS have greater potential to adsorb to particulates and organic matter due to increased hydrophobic properties, and the sulfonate moiety of PFSAs increases adsorption relative to PFCAs (Higgins and Luthy, 2006; Pan et al., 2016; Tavasoli et al., 2021).
Land application of biosolids, runoff, and plant uptake
Land application of PFAS laden municipal biosolids resulted in PFAS at detectable levels in the surface runoff of our biosolid treated plots. The results in this study suggest that PFAS may be transported through runoff from biosolids-treated soils. Run-off concentrations of the total Σ12 PFAS residue decreased over time (August to September) suggesting that losses will diminish as easily-mobilized contaminants are lost from treated soils on a temporal scale due to rainfall events. Three rainfall events occurred in August (30.7 mm) and September had 3 events (62.5 mm), with only 1 event producing enough volume to sample each month. Gottschall et al. (2017) reported PFOS in soil throughout a yearlong study, and Chu and Letcher (2017) also suggested that soils applied with municipal biosolids may instigate the discovery of PFAS in these amended soils.
Figure 3 shows that PFHxA (0.0358 mg) and NMeFOSAA (0.0351 mg) comprised the highest masses in the 0–10 cm sampled portion of the soil column (Figure 3). Based on our estimates, transport of nearly 3.93 mg or 96.9% of PFAS mass applied may have been retained in biosolids on soil surface or lost through other pathways such as degradation, infiltration, or volatilization. Previous studies have reported possible PFAS movement through infiltration (Pepper et al., 2021) after land application of biosolids.
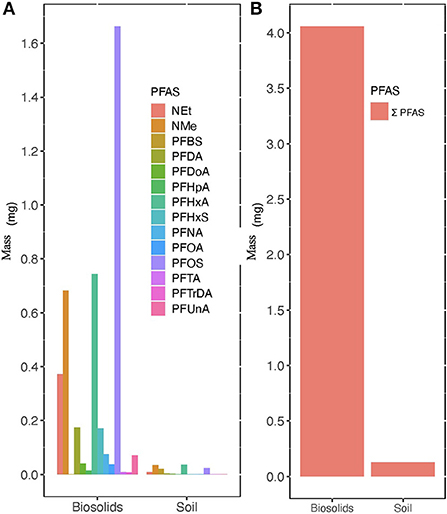
Figure 3. Average mass concentrations in mg of PFAS found in 177 kg of municipal biosolids land applied to treatment plots and in the top 10 cm of the soil on 25.2 m2 treatment plots in October. (A) Represents the average mass (mg) of 14 PFAS and (B) represents the average Σ14 of mass (mg) of PFAS. Equations which represent calculation of final mass provided in Supplementary material.
No detectable levels of the 18 PFAS were found in grain sorghum samples grown on test plots. Similarly, Gottschall et al. (2017) did not detect PFAS in crops (maize, soybean, wheat) on fields applied with municipal biosolids. Other studies have reported conflicting results, noting detectable concentrations of PFAS in differing crop types (lettuce, tomato, wheat, pumpkin) (Blaine et al., 2014; Lee et al., 2014; Wen et al., 2014). Our result of no detection with grain sorghum may have been influenced by the late application of municipal biosolids on to our biosolid plots. Rankin et al. (2016) reported widespread occurrence of PFAS in surface soils (0–10 cm) throughout the US. In comparison, the control plots contained low concentrations of 10 PFAS in the surface runoff and in the soil column. Degradation of PFAS precursors, atmospheric deposition, contaminated precipitation, and pesticide application are possible sources of detected background levels of PFAS (Kim and Kannan, 2007; Gottschall et al., 2017; Arinaitwe et al., 2021; Nguyen, 2021).
Conclusions
This study describes methods for measurement of PFAS in several environmental compartments and reports the occurrences of PFAS within a WWTP, receiving surface water, and agricultural system receiving municipal biosolids. To the author's knowledge, this is one of the first reports to evaluate extraction techniques for this group of PFAS in four environmental matrices. Current extraction techniques provide satisfactory recoveries, however, variations in field sample surrogate recoveries suggest a need for improved extract cleanup in environmental samples. The Σ14 PFAS concentrations at upstream and influent sites were not significantly different suggesting similar sources of urban contamination. The investigated WWTP was not effective at removing PFAS and individual PFAAs may increase potentially due to individual contaminant changes in temporal loading, desorption, and degradation of PFAA precursors. Our results are consistent with previous studies showing that WWTP effluent is a source of PFAS to receiving surface water, and that biosolids land applied can serve as a route of entry onto cropland. The mass balance of PFAS applied within biosolids to agricultural plots indicates that surface soil and runoff events in August and September only accounted for 3.12% of Σ PFAS applied, indicating that the majority (96.9%) of the mass of PFAS applied is transported or retained through unidentified routes. Further research is needed to determine the mass balance of PFAS within WWTPs and on fields receiving the land application of contaminated municipal biosolids.
Data availability statement
The original contributions presented in the study are included in the article/Supplementary material, further inquiries can be directed to the corresponding author/s.
Author contributions
JC: investigation, writing—original draft, and writing—review and editing. DS: project administration, investigation, resources, supervision, and writing—review and editing. TM and SB-H: project administration, investigation, supervision, and writing—review and editing. All authors contributed to the article and approved the submitted version.
Funding
The work done in this research study was supported in majority by the United States Geological Survey (USGS) by the USGS 104(b) Grant (No. 2020NE186B) for the 2020-2021 school year obtained by DS, TM, and SB-H.
Acknowledgments
The authors would like to thank the WWTP for access to the wastewater sources, discharge data, and biosolid production data. A special thanks to the Water Sciences Laboratory for access to laboratory equipment utilized to extract and analyze PFAS from complex matrices.
Conflict of interest
The authors declare that the research was conducted in the absence of any commercial or financial relationships that could be construed as a potential conflict of interest.
Publisher's note
All claims expressed in this article are solely those of the authors and do not necessarily represent those of their affiliated organizations, or those of the publisher, the editors and the reviewers. Any product that may be evaluated in this article, or claim that may be made by its manufacturer, is not guaranteed or endorsed by the publisher.
Author disclaimer
Any opinions, findings, conclusions, or recommendations expressed in this publication are those of the author(s) and do not necessarily reflect the view of the USGS.
Supplementary material
The Supplementary Material for this article can be found online at: https://www.frontiersin.org/articles/10.3389/frwa.2022.892451/full#supplementary-material
References
Ahrens, L., and Bundschuh, M. (2014). Fate and effects of poly- and perfluoroalkyl substances in the aquatic environment: a review. Environ. Toxicol. Chem. 33, 1921–1929. doi: 10.1002/etc.2663
Ahrens, L., Felizeter, S., Sturm, R., Xie, Z., and Ebinghaus, R. (2009). Polyfluorinated compounds in waste water treatment plant effluents and surface waters along the River Elbe, Germany. Mar. Pollut. Bull. 58, 1326–1333. doi: 10.1016/j.marpolbul.2009.04.028
Arinaitwe, K., Keltsch, N., Taabu-Munyaho, A., Reemtsma, T., and Berger, U. (2021). Perfluoroalkyl substances (PFASs) in the Ugandan waters of Lake Victoria: spatial distribution, catchment release and public exposure risk via municipal water consumption. Sci. Total Environ. 783. doi: 10.1016/j.scitotenv.2021.146970
Bao, J., Yu, W. J., Liu, Y., Wang, X., Jin, Y. H., and Dong, G. H. (2019). Perfluoroalkyl substances in groundwater and home-produced vegetables and eggs around a fluorochemical industrial park in China. Ecotoxicol. Environ. Saf. 171, 199–205. doi: 10.1016/j.ecoenv.2018.12.086
Barry, V., Winquist, A., and Steenland, K. (2013). ‘Perfluorooctanoic acid (PFOA) exposures and incident cancers among adults living near a chemical plant. Environ. Health Perspect. 121, 1313–1318. doi: 10.1289/ehp.1306615
Blaine, A. C., Rich, C. D., Sedlacko, E. M., Hyland, K. C., Stushnoff, C., Dickenson, E. R. V., et al. (2014). Perfluoroalkyl acid uptake in lettuce (Lactuca sativa) and Strawberry (Fragaria ananassa) irrigated with reclaimed water. Environ. Sci. Technol. 48, 14361–14368. doi: 10.1021/es504150h
Boiteux, V., Bach, C., Sagres, V., and Hermad, J. (2016). Analysis of 29- per- and polyfluorinated compounds in water, sediment, soil and sludge by liquid chromatography-tandem mass spectrometry. Int. J. Environ. Anal. Chem. 96, 705–728. doi: 10.1080/03067319.2016.1196683
Campo, J., Masiá, A., Picó, Y., Farré, M., and Barceló, D. (2014). Distribution and fate of perfluoroalkyl substances in Mediterranean Spanish sewage treatment plants. Sci. Total Environ. 472, 912–922. doi: 10.1016/j.scitotenv.2013.11.056
Chu, S., and Letcher, R. J. (2017). Side-chain fluorinated polymer surfactants in aquatic sediment and biosolid-augmented agricultural soil from the Great Lakes basin of North America. Sci. Total Environ. 607–608, 262–270. doi: 10.1016/j.scitotenv.2017.06.252
Codling, G., Yuan, H., Jones, P. D., Giesy, J. P., and Hecker, M. (2020). Metals and PFAS in stormwater and surface runoff in a semi-arid Canadian city subject to large variations in temperature among seasons. Environ. Sci. Pollut. Res. 27, 18232–18241. doi: 10.1007/s11356-020-08070-2
Darrow, L. A., Stein, C. R., and Steenland, K. (2013). ‘Serum perfluorooctanoic acid and perfluorooctane sulfonate concentrations in relation to birth outcomes in the Mid-Ohio Valley, 2005-2010. Environ. Health Perspect. 121, 1207–1213. doi: 10.1289/ehp.1206372
Domingo, J. L., and Nadal, M. (2017). ‘Per- and polyfluoroalkyl substances (PFASs) in food and human dietary intake: a review of the recent scientific literature. J. Agric. Food Chem. 65, 533–543. doi: 10.1021/acs.jafc.6b04683
Dong, Z., Wang, H., Yu, Y. Y., Li, Y. B., Naidu, R., and Liu, Y. (2019). Using 2003–2014 U.S. NHANES data to determine the associations between per- and polyfluoroalkyl substances and cholesterol: trend and implications. Ecotoxicol. Environ. Saf. 173, 461–468. doi: 10.1016/j.ecoenv.2019.02.061
Gallen, C., Eaglesham, G., Drage, D., Nguyen, T. H., and Mueller, J. F. (2018). A mass estimate of perfluoroalkyl substance (PFAS) release from Australian wastewater treatment plants. Chemosphere 208, 975–983. doi: 10.1016/j.chemosphere.2018.06.024
Gobelius, L., Hedlund, J., Dürig, W., Tröger, R., Lilja, K., Wiberg, K., et al. (2018). Per- and polyfluoroalkyl substances in swedish groundwater and surface water: implications for environmental quality standards and drinking water guidelines. Environ. Sci. Technol. 52, 4340–4349. doi: 10.1021/acs.est.7b05718
Gobelius, L., Persson, C., Wiberg, K., and Ahrens, L. (2019). Calibration and application of passive sampling for per- and polyfluoroalkyl substances in a drinking water treatment plant. J. Hazardous Mater. 362, 230–237. doi: 10.1016/j.jhazmat.2018.09.005
Gonzalez, D., Thompson, K., Quiñones, O., Dickenson, E., and Bott, C. (2021). Assessment of PFAS fate, transport, and treatment inhibition associated with a simulated AFFF release within a WASTEWATER treatment plant. Chemosphere 262, 127900. doi: 10.1016/j.chemosphere.2020.127900
Gottschall, N., Topp, E., Edwards, M., Payne, M., Kleywegt, S., and Lapen, D. R. (2017). Brominated flame retardants and perfluoroalkyl acids in groundwater, tile drainage, soil, and crop grain following a high application of municipal biosolids to a field. Sci. Total Environ. 574, 1345–1359. doi: 10.1016/j.scitotenv.2016.08.044
Groffen, T., Wepener, V., Malherbe, W., and Bervoets, L. (2018). Distribution of perfluorinated compounds (PFASs) in the aquatic environment of the industrially polluted Vaal River, South Africa. Sci. Total Environ. 627, 1334–1344. doi: 10.1016/j.scitotenv.2018.02.023
Harrington, L. M. (2017). Analysis of perfluoroalkyl and polyfluoroalkyl substances in serum and plasma by solvent precipitation-isotope dilution-direct injection-LC/MS/MS. Analytical Methods 9, 473–481. doi: 10.1039/C6AY02809H
Heinze, J. E., Nakayama, S. F., Strynar, M., and Laurence, H. (2008). Perfluorinated compounds in the Cape Fear Drainage Basin in North Carolina. Environ. Sci. Technol. 42, 1385–1386. doi: 10.1021/es702491q
Helsel, D. R. (1990). Less than obvious: Statistical treatment of data below the detection limit. Environmental Science and Technology 24, 1766–1774. doi: 10.1021/es00082a001
Higgins, C. P., and Luthy, R. G. (2006). Sorption of perfluorinated surfactants on sediments. Environ. Sci. Technol. 40, 7251–7256. doi: 10.1021/es061000n
Holtcamp, W. (2012). Pregnancy-induced hypertension “probably linked” to PFOA contamination. Environ. Health Perspect. 120, a59. doi: 10.1289/ehp.120-a59
Houtz, E., Wang, M., and Park, J. S. (2018). Identification and fate of aqueous film forming foam derived per- and polyfluoroalkyl substances in a wastewater treatment plant. Environ. Sci. Technol. 52, 13212–13221. doi: 10.1021/acs.est.8b04028
Houtz, E. F., Sutton, R., Park, J. S., and Sedlak, M. (2016). Poly- and perfluoroalkyl substances in wastewater: significance of unknown precursors, manufacturing shifts, and likely AFFF impacts. Water Res. 95, 142–149. doi: 10.1016/j.watres.2016.02.055
KEMI (2015). Occurrence and use of highly fluorinated substances and alternatives. Swedish Chem. Agency 1, 1–78.
Kim, S. K., and Kannan, K. (2007). Perfluorinated acids in air, rain, snow, surface runoff, and lakes: relative importance of pathways to contamination of urban lakes. Environ. Sci. Technol. 41, 8328–8334. doi: 10.1021/es072107t
Lee, H., Tevlin, A. G., and Mabury, S. A. (2014). Fate of polyfluoroalkyl phosphate diesters and their metabolites in biosolids-applied soil: biodegradation and plant uptake in greenhouse and field experiments. Environ. Sci. Technol. 48, 340–349. doi: 10.1021/es403949z
Lenka, S. P., Kah, M., and Padhye, L. P. (2021). A review of the occurrence, transformation, and removal of poly- and perfluoroalkyl substances (PFAS) in wastewater treatment plants. Water Res. 199, 117187. doi: 10.1016/j.watres.2021.117187
Lu, Q., He, Z. L., and Stoffella, P. J. (2012). Land application of biosolids in the USA: a review. Appl. Environ. Soil Sci. 2012, 201462. doi: 10.1155/2012/201462
Lum, K. J., Sundaram, R., Barr, D. B., Louis, T. A., and Buck Louis, G. M. (2017). Perfluoroalkyl chemicals, menstrual cycly length, and fecundity: findings from a prosepctive pregnancy study. Epidemiology 28, 90–98. doi: 10.1097/EDE.0000000000000552
Mueller, R., and Yingling, V. (2018). Naming Conventions and Physical and Chemical Properties of Per- and Polyfluoroalkyl Substances. Washington, DC: Interstate Technology Regulatory Council.
Naderi Beni, N., Snow, D. D., Berry, E. D., Mittelstet, A. R., Messer, T. L., and Bartelt-Hunt, S. (2020). Measuring the occurrence of antibiotics in surface water adjacent to cattle grazing areas using passive samplers. Sci. Total Environ. 726, 138296. doi: 10.1016/j.scitotenv.2020.138296
Nakayama, S. F., Strynar, M. J., Reiner, J. L., Delinsky, A. D., and Lindstrom, A. B. (2010). Determination of perfluorinated compounds in the upper Mississippi River Basin. Environ. Sci. Technol. 44, 4103–4109. doi: 10.1021/es100382z
Nguyen, T. (2021). Rinses from selected fluorinated and non-fluorinated HDPE containers. United States Environ. Protect. Agency 20460, 1–10.
Organtini, K. L., Hird, S., and Adams, S. (2021). QuEChERS extraction of per- and polyfluoroalkyl substances (PFAS) from edible produce with sensitive analysis on Xevo TQ-XS. Waters 1, 1–16
Pan, C. G., Liu, Y. S., and Ying, G. G. (2016). Perfluoroalkyl substances (PFASs) in wastewater treatment plants and drinking water treatment plants: removal efficiency and exposure risk. Water Res. 106, 562–570. doi: 10.1016/j.watres.2016.10.045
Park, M., Wu, S., Lopez, I. J., Chang, J. Y., Karanfil, T., and Snyder, S. A. (2020). Adsorption of perfluoroalkyl substances (PFAS) in groundwater by granular activated carbons: roles of hydrophobicity of PFAS and carbon characteristics. Water Res. 170, 115364. doi: 10.1016/j.watres.2019.115364
Pepper, I. L., Brusseau, M. L., Prevatt, F. J., and Escobar, B. A. (2021). Incidence of PFAS in soil following long-term application of class B biosolids. Sci. Total Environ. 793, 148449. doi: 10.1016/j.scitotenv.2021.148449
Rankin, K., Mabury, S. A., Jenkins, T. M., and Washington, J. W. (2016). A North American and global survey of perfluoroalkyl substances in surface soils: distribution patterns and mode of occurrence. Chemosphere 161, 333–341. doi: 10.1016/j.chemosphere.2016.06.109
Semerád, J., Hatasová, N., Grasserová, A., Cerná, T., Filipová, A., Hanč, A., et al. (2020). Screening for 32 per- and polyfluoroalkyl substances (PFAS) including GenX in sludges from 43 WWTPs located in the Czech Republic - evaluation of potential accumulation in vegetables after application of biosolids. Chemosphere 261, 128018. doi: 10.1016/j.chemosphere.2020.128018
Shoemaker, J., and Tettenhorst, D. (2020). Method 537.1 - Determination of selected per- and polyfluorinated alkyl substances in drinking water by solid phase extraction and liquid chromatography/tandem mass spectrometry (LC/MS/MS). USEPA Office Res. Dev. 1, 1–50.
Sinclair, E., and Kannan, K. (2006). Mass loading and fate of perfluoroalkyl surfactants in wastewater treatment plants. Environ. Sci. Technol. 40, 1408–1414. doi: 10.1021/es051798v
Snow, D. D., Damon-Powell, T., Onanong, S., and Cassada, D. A. (2013). Sensitive and simplified analysis of natural and synthetic steroids in water and solids using on-line solid-phase extraction and microwave-assisted solvent extraction coupled to liquid chromatography tandem mass spectrometry atmospheric pressure photoioni. Anal. Bioanal. Chem. 405, 1759–1771. doi: 10.1007/s00216-012-6572-8
So, M. K., Miyake, Y., Yeung, W. Y., Ho, Y. M., Taniyasu, S., Rostkowski, P., et al. (2007). Perfluorinated compounds in the Pearl River and Yangtze River of China. Chemosphere 68, 2085–2095. doi: 10.1016/j.chemosphere.2007.02.008
Steenland, K., Zhao, L., Winquist, A., and Parks, C. (2013). Ulcerative colitis and perfluorooctanoic acid (PFOA) in a highly exposed population of community residents and workers in the Mid-Ohio Valley. Environ. Health Perspect. 121, 900–905. doi: 10.1289/ehp.1206449
Tavasoli, E., Luek, J. L., Malley, J. P., and Mouser, P. J. (2021). Distribution and fate of per- And polyfluoroalkyl substances (PFAS) in wastewater treatment facilities. Environ. Sci. Process. Impacts 23, 903–913. doi: 10.1039/D1EM00032B
USDA (2014). Farms and farmland: numbers, acreage, ownership, and use. CENSUS of Agriculture Highlights. Available online at: https://www.nass.usda.gov/Publications/Highlights/2014/Highlights_Farms_and_Farmland.pdf (accessed October 12, 2022).
USEPA (1986). Appendix B to part 136 - Definition and Procedure for the Determination of the Method Detection Limit - Revision 1.11. Washington, DC: US Environmental Protection Agency. p. 343–346.
USEPA (2022). Lifetime Drinking Water Health Advisories for Four Perfluoroalkyl Substances. US Environmental Protection Agency 2022-13158, 87 FR 36848. p. 36848–36849. Available online at: https://www.federalregister.gov/d/2022-13158 (accessed October 26, 2022).
Vélez, M. P., Arbuckle, T. E., and Fraser, W. D. (2015). Female exposure to phenols and phthalates and time to pregnancy: the Maternal-Infant Research on Environmental Chemicals (MIREC) Study. Fertil. Steril. 103, 1011-1020.e2. doi: 10.1016/j.fertnstert.2015.01.005
Venkatesan, A. K., and Halden, R. U. (2013). National inventory of perfluoroalkyl substances in archived U.S. biosolids from the 2001 EPA National Sewage Sludge Survey. J. Hazardous Mater. 252–253, 413–418. doi: 10.1016/j.jhazmat.2013.03.016
Wang, Z., Dewitt, J. C., Higgins, C. P., and Cousins, I. T. (2017). A never-ending story of per- and Polyfluoroalkyl Substances (PFASs)? Environ. Sci. Technol. 51, 2508–2518. doi: 10.1021/acs.est.6b04806
Webster, G. M., Venners, S. A., Mattman, A., and Martin, J. W. (2014). Associations between Perfluoroalkyl acids (PFASs) and maternal thyroid hormones in early pregnancy: A population-based cohort study. Environ. Res. 133, 338–347. doi: 10.1016/j.envres.2014.06.012
Wen, B., Li, L., Zhang, H., Ma, Y., Shan, X. Q., and Zhang, S. (2014). Field study on the uptake and translocation of perfluoroalkyl acids (PFAAs) by wheat (Triticum aestivum L.) grown in biosolids-amended soils. Environ. Poll. 184, 547–554. doi: 10.1016/j.envpol.2013.09.040
Winquist, A., and Steenland, K. (2014). High cholesterol in community and worker cohorts. Environ. Health Perspect. 122, 1299–1305. doi: 10.1289/ehp.1307943
Zhang, W., Zhang, Y., Taniyasu, S., Yeung, L. W. Y., Lam, P. K. S., Wang, J., et al. (2013). Distribution and fate of perfluoroalkyl substances in municipal wastewater treatment plants in economically developed areas of China. Environ. Poll. 176, 10–17. doi: 10.1016/j.envpol.2012.12.019
Zushi, Y., and Masunaga, S. (2009). Identifying the nonpoint source of perfluorinated compounds using a geographic information system based approach. Environ. Toxicol. Chem. 28, 691–700. doi: 10.1897/08-194.1
Keywords: PFAS, POCIS, wastewater treatment plant, agricultural ecosystems, surface waters
Citation: Caniglia J, Snow DD, Messer T and Bartelt-Hunt S (2022) Extraction, analysis, and occurrence of per- and polyfluoroalkyl substances (PFAS) in wastewater and after municipal biosolids land application to determine agricultural loading. Front. Water 4:892451. doi: 10.3389/frwa.2022.892451
Received: 09 March 2022; Accepted: 03 October 2022;
Published: 27 October 2022.
Edited by:
Yun-Ya Yang, Andes Ag, Inc., United StatesReviewed by:
Urs Jans, City College of New York (CUNY), United StatesDong-Xing Guan, Zhejiang University, China
Copyright © 2022 Caniglia, Snow, Messer and Bartelt-Hunt. This is an open-access article distributed under the terms of the Creative Commons Attribution License (CC BY). The use, distribution or reproduction in other forums is permitted, provided the original author(s) and the copyright owner(s) are credited and that the original publication in this journal is cited, in accordance with accepted academic practice. No use, distribution or reproduction is permitted which does not comply with these terms.
*Correspondence: Daniel D. Snow, dsnow1@.unl.edu